At the beginning of February, the Bruins were amidst a downward spiral, having lost six of their previous nine games, that could eventually see them miss the playoffs for a third straight year. During this streak, the Bruins were embarrassed 4-0 on home ice to the last-place New York Islanders and blew a 3-0 lead against the lowly Detroit Red Wings to eventually lose 6-5 in a shootout. The team had some obvious lack of depth on the wing, defense, and backup goaltender positions, but they weren’t winning the games that they should have. The Bruins were clinging onto the third and final divisional playoff position but having already played a handful more games than the teams closing on them in the standings, the Bruins only had a 35% chance of qualifying for the playoffs.
On February 7, the Bruins finally made the move that many were calling for the team to make since the end of last season. Head coach Claude Julien was fired and assistant coach Bruce Cassidy was promoted to Julien’s old position on an interim basis. Cassidy inherited the Bruins’ biggest issue of converting shots in goals. At the time of the firing, the Bruins had a 55.46% CF%, 53.22% SCF%, and a 55.83% xGF% but only a GF% of 45.22% (all metrics presented in this article are 5v5 and adjusted for score, zone & venue unless specifically noted). Despite consistently outshooting and outchancing their opponents, the Bruins were struggling because of their league-worst 5.97% SH% at even strength (non-adjusted). The result of this was scoring a league-worst 24 goals under their expected goal for total on the season (87.55 GF compared to 111.78 xGF).
In order to fix the Bruins’ largest problem, Cassidy had to find a way to way to generate higher quality chances. As we have just crossed the midway point of Cassidy getting promoted and the conclusion of the NHL regular season, now is a perfect time to check in on how he has been able to alter the Bruins system in order to spark a playoff rally.
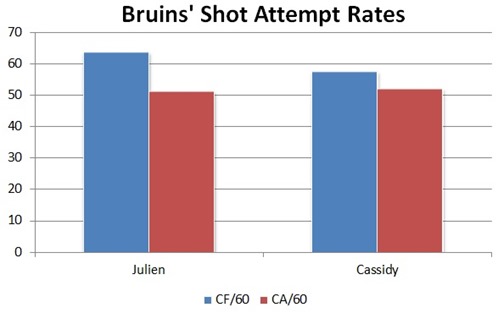
Julien’s high powered offense recorded almost 64 shot attempts per 60 minutes of ice time while giving up only 51 (sample size of 55 games to start the 2016-2017 season). Under Cassidy, the Bruins shot attempt differential rate has shrunk by over half but still remains positive as they have registered over 57 shot attempts and while allowing 52 over the same span (sample size of 13 games starting on February 9, 2017). Shot attempts aren’t always indicative of shot quality so let’s see how the coaching change has affected the Bruins expected goal rates.
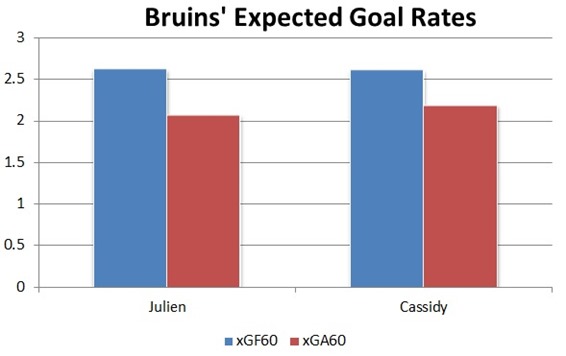
Despite attempting a fewer number of shots, Cassidy’s Bruins have been able to maintain the same exact number of expected goals for per 60 minutes of ice time. How are they able to do this? A logical explanation is that the Bruins are taking shot attempts that hold higher expected goal values that make up for the decline in number of shot attempts under Cassidy. Let’s delve a little deeper and look at scoring chances to confirm that the Bruins have been generating higher quality opportunities.
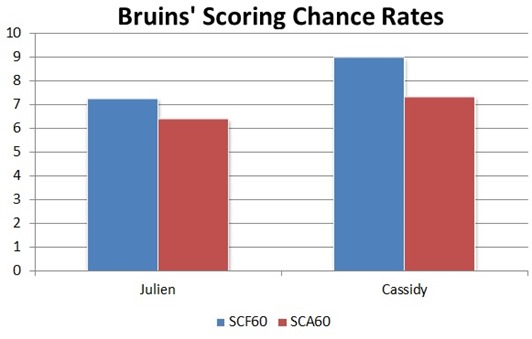
The Bruins averaged just over seven scoring chances per 60 minutes with Julien behind the bench. In the last month, that average jumped up to nine scoring chances in the same time span. This is proof that they’re getting better chances. The Bruins have also given up more scoring chances against after the coaching change, but the increase of almost two scoring chances for has increased the team’s percent share. Lastly, we have to ask how well the Bruins are doing at converting a higher rate of scoring chances into goals.
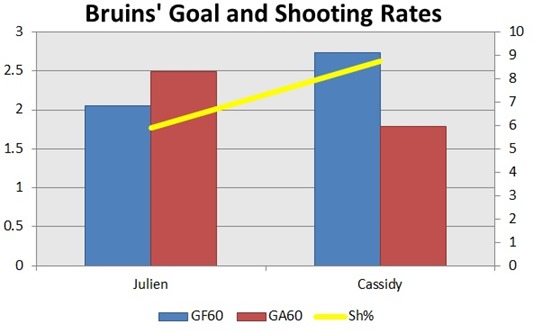
Ultimately, results matter. A team’s underlying numbers could be spectacular but they won’t make the playoffs or challenge for the Stanley Cup if the results aren’t there to match it (see the Carolina Hurricanes for example). The results for the Bruins under Julien this season weren’t great even though the analytics were off the charts; the team only scored two goals for every two and a half they gave up.
Systematic changes instilled by Cassidy led to the Bruins fewer shot attempts but more attempts at a higher quality. The team has been able to effectively convert an increased share of shots from higher percentage areas on the ice into goals as their SH% has risen from 5.91% to 8.76% from Julien to Cassidy (shown above on the secondary axis). The coaching change resulted in a complete 180 from earlier in the season as they are scoring at a higher rate and giving up goals at a much lower rate (the goals against can be largely credited to the improved play of Tuukka Rask down the stretch who has a 92.86% 5v5 SV% since the coaching change compared to a 91.56% 5v5 SV% to start the season among other factors).
Cassidy has ridden an unsustainable 101.91 PDO to a 10-3 record to start his tenure as head coach of the Bruins, but the underlying numbers have been very impressive so this success can be expected to continue. Cassidy has effectively solved the Bruins largest issue of scoring goals by trading shot quantity for quality shots. This has directly impacted the team’s 5v5 goal differential and put the team in a position to quality for the playoffs.
Follow Steve Ness on Twitter: @QuickkNess
All data from HockeyViz, Corsica.Hockey, NHL.com.

